Complete pipeline
Introductory notes:
This notebook presents minimal functionality needed to go through the cleaning, ICA, spectral, and event analysis stages.
For the cleaning part, the functionality consists of resampling, filtering, bad channels and bad data spans annotation, and bad channels interpolation.
For the ICA part, it is fitting and selecting components you want to exclude.
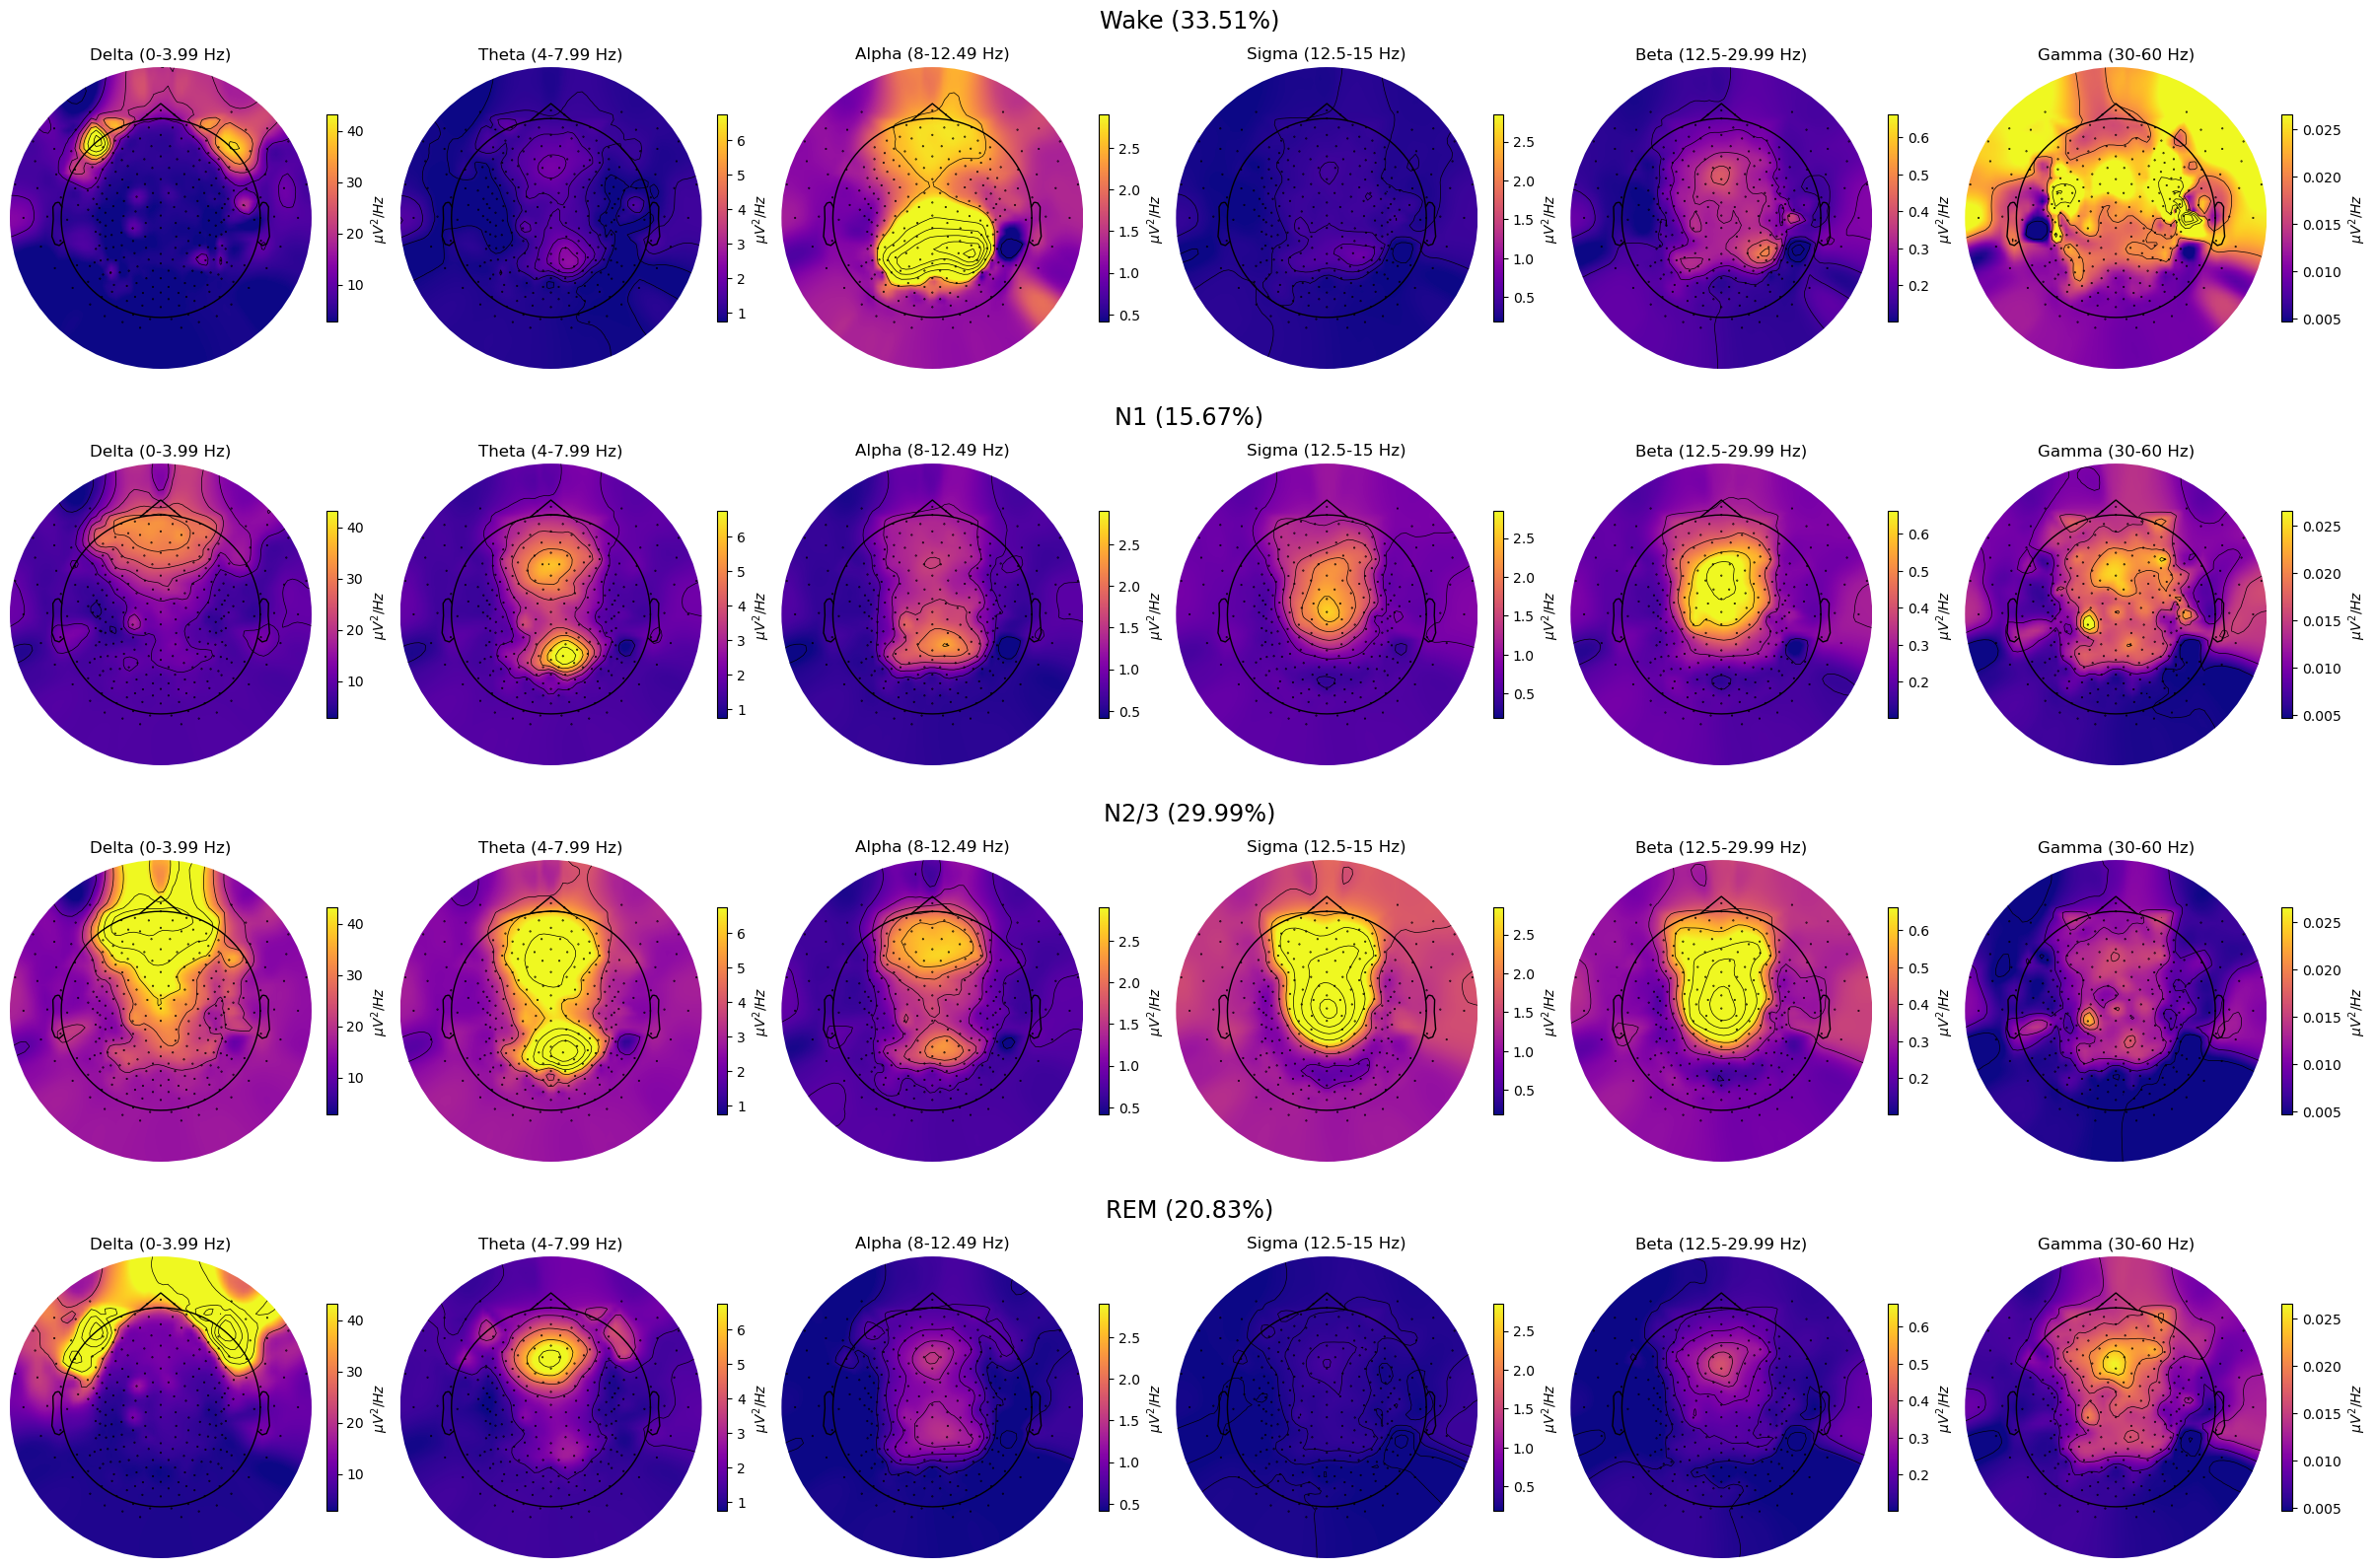
For the spectral analyses part, it is spectrogram+hypnogram, PSD per sleep stage, and topomap per sleep stage per frequency band.
For the detection of the events, it is spindles, slow waves, and rapid eye movements detection and analysis.
For the extended functionality check out the corresponding notebooks.
Import module
import os
import sys
import sleepeegpy
Run the following code
###### This code contains widgets that will be previewed later in the notebook. ######
####### Run this code and continue. ######
import ipywidgets as widgets
from IPython.display import display

use_example_set = widgets.RadioButtons(
    options=[True, False], description="Use example set?", value=True
)
bad_channels_selection = widgets.RadioButtons(
    options=["automatically", "manually", "from-file"],
    description="Clean Bad Channels:",
    value="from-file",
)
annotations_selection = widgets.RadioButtons(
    options=["automatically", "manually", "from-file"],
    description="Clean bad epochs Annotations:",
    value="from-file",
)

hypno_selection = widgets.RadioButtons(
    options=["automatically", "from-file"], description="Hypnogram:", value="from-file"
)
import pooch
from sleepeegpy.pipeline import (
    CleaningPipe,
    ICAPipe,
    SpectralPipe,
    SpindlesPipe,
    SlowWavesPipe,
    RapidEyeMovementsPipe,
)
from sleepeegpy.dashboard import create_dashboard
Setup Input Files
By default, all the input files are assumed to be saved in input_files, which will be created (if not already exist) in the notebook path. Change the following strings to use another path. Changing the output directory is also optional.
from os import makedirs

output_dir = "output_folder"  # Output path and name can be changed here
input_dir = "input_files"  # input files dir can be changed here
makedirs(input_dir, exist_ok=True)
makedirs(output_dir, exist_ok=True)
Pipeline preference:
Change the values according to how you want to use the pipeline.
display(use_example_set)
display(bad_channels_selection)
display(annotations_selection)
display(hypno_selection)
Add requested files
Run the code below, add all requested files (according to your preference) in the input file, and write their names.
Instructions:
Put your files in the input directory.
EEG file must include a montage that works with mne.read_raw.
For more information about the mne.read_raw supported formats, see mne documentation
If your file has no montage, but there is a channel mapping, you can add montage in the cleaning part (there is an example below of one way to add it).
#### If you use your own files (not the example set), write the relevant filenames below. ###

subject_code = "DK8"  # The subject code that will appear in the dashboard
eeg_file = "resampled_raw.fif"
bad_channels = "bad_channels.txt"
annotations = "annotations.txt"
If you are using hypnogram file:
Modify your hypnogram file name (Point-per-row type of hypnogram) below.
If needed, change the Hypnogram’s sampling frequency
If you don’t have a hypnogram file, follow the next notebook instructions.
hypnogram_filename = "staging.txt"
hypno_freq = 1  # If required, change the Hypnogram's sampling frequency (Visbrain's hypnograms default to 1)
Modify hypnogram prediction arguments
If you don’t have hypnogram file, choose prediction arguments. These values will use YASA’s algorithm to create a new hypnogram.
Make sure the selected channel names exist in your montage
if hypno_selection.value == "automatically":
    hypnogram_path = "predict"
    #### If you selected automatic hypnogram, select prediction arguments. ####
    hypno_predict_arguments = {
        "eeg_name": "E183",  # (C4)
        "eog_name": "E252",  # (EOG1)
        "emg_name": "E247",
        "ref_name": "E26",
        "save": False,
    }
else:
    hypno_predict_arguments = None
Adjust variables
If required, change
n_components- should equal or less than the number of channels. see more informationModify the picked channel.
picked_channelrepresents the EEG channel selected for plotting and computations of hypnospectrogram, PSDs, and TFRs.Modify the variable in the next notebook cells, to have separate channels for each plot.
Modify loc_chname and roc_chname (EOG). For more information see: Left and Right Ocular Canthi.
Make sure all channel names are part of the montage.
n_components = 30
picked_channel = "E101"  # (Pz)
loc_chname = "E252"  # (EOG1)
roc_chname = "E226"  # (EOG2)
You can now run the notebook (you can change values according to your needs)
if use_example_set.value:
    cache_dir = pooch.os_cache("sleepeegpy_dataset")
    doi = "10.5281/zenodo.10362189"
    odie = pooch.create(
        path=cache_dir,
        base_url=f"doi:{doi}",
    )
    odie.load_registry_from_doi()
if use_example_set.value:
    ## Nap dataset files: ##
    bad_channels = odie.fetch("nap_bad_channels.txt")
    annotations = odie.fetch("nap_annotations.txt")
    path_to_eeg = odie.fetch("nap_resampled_raw.fif", progressbar=True)
    if hypno_selection.value == "from-file":
        hypnogram_path = odie.fetch("nap_staging.txt", progressbar=True)
else:
    path_to_eeg = os.path.join(input_dir, eeg_file)
    if hypno_selection.value == "from-file":
        hypnogram_path = os.path.join(input_dir, hypnogram_filename)
    bad_channels = (
        None
        if bad_channels_selection == "automatically"
        else os.path.join(input_dir, bad_channels)
    )
    annotations = (
        None
        if annotations_selection == "automatically"
        else os.path.join(input_dir, annotations)
    )
Cleaning
Initialize CleaningPipe object by providing it with path to eeg file and output directory in which you want the data to be saved.
pipe = CleaningPipe(
    path_to_eeg=path_to_eeg,
    output_dir=output_dir,
)
##### Adding montage example ####
# import mne
# channels_map = {"E59": "C3", "E183": "C4", "E36": "F3", "E224": "F4", "E47": "F7", "E2": "F8","E37": "Fp1", "E18": "Fp2", "E21": "Fz", "E116": "O1", "E150": "O2", "E87": "P3", "E153": "P4", "E101": "Pz","E69": "T3", "E202": "T4", "E96": "T5", "E170": "T6", "E94": "A1", "E190": "A2"}
# current_channel_names = set(pipe.mne_raw.ch_names)
# channels_to_drop = list(current_channel_names - set(channels_map.keys()))
# pipe.mne_raw.drop_channels(channels_to_drop)
# mne.rename_channels(pipe.mne_raw.info, channels_map)
# montage = mne.channels.make_standard_montage('standard_1020')
# pipe.mne_raw.set_montage(montage)
Resampling
This can take more than an hour depending on eeg signal size and specs of the computer you’re running the analysis on.
pipe.resample(sfreq=250)
pipe.filter(l_freq=0.75, h_freq=40)
pipe.notch(freqs="50s")
Select bad channels and epochs
If manually bad channels were selected, select bad channels in the pop-up window. Note that automatically bad channels selection takes time.
if bad_channels_selection.value == "manually":
    pipe.plot(save_bad_channels=True)
elif bad_channels_selection.value == "automatically":
    bad_channels = pipe.auto_detect_bad_channels()
pipe.read_bad_channels(
    path=None if bad_channels_selection.value == "Manually" else bad_channels
)
pipe.interpolate_bads(reset_bads=True)
Interpolated channels: ['E9', 'E45', 'E54', 'E122', 'E200', 'E256', 'VREF']
Select bad epochs
Click “a” -> “Add description” -> Enter BAD_EPOCH -> Annotate bad data spans
if annotations_selection.value == "manually":
    pipe.plot(butterfly=True, save_annotations=True, overwrite=True)
    pipe.read_annotations()
elif annotations_selection.value == "from-file":
    pipe.read_annotations(path=annotations)
elif annotations_selection.value == "automatically":
    pipe.auto_set_annotations()
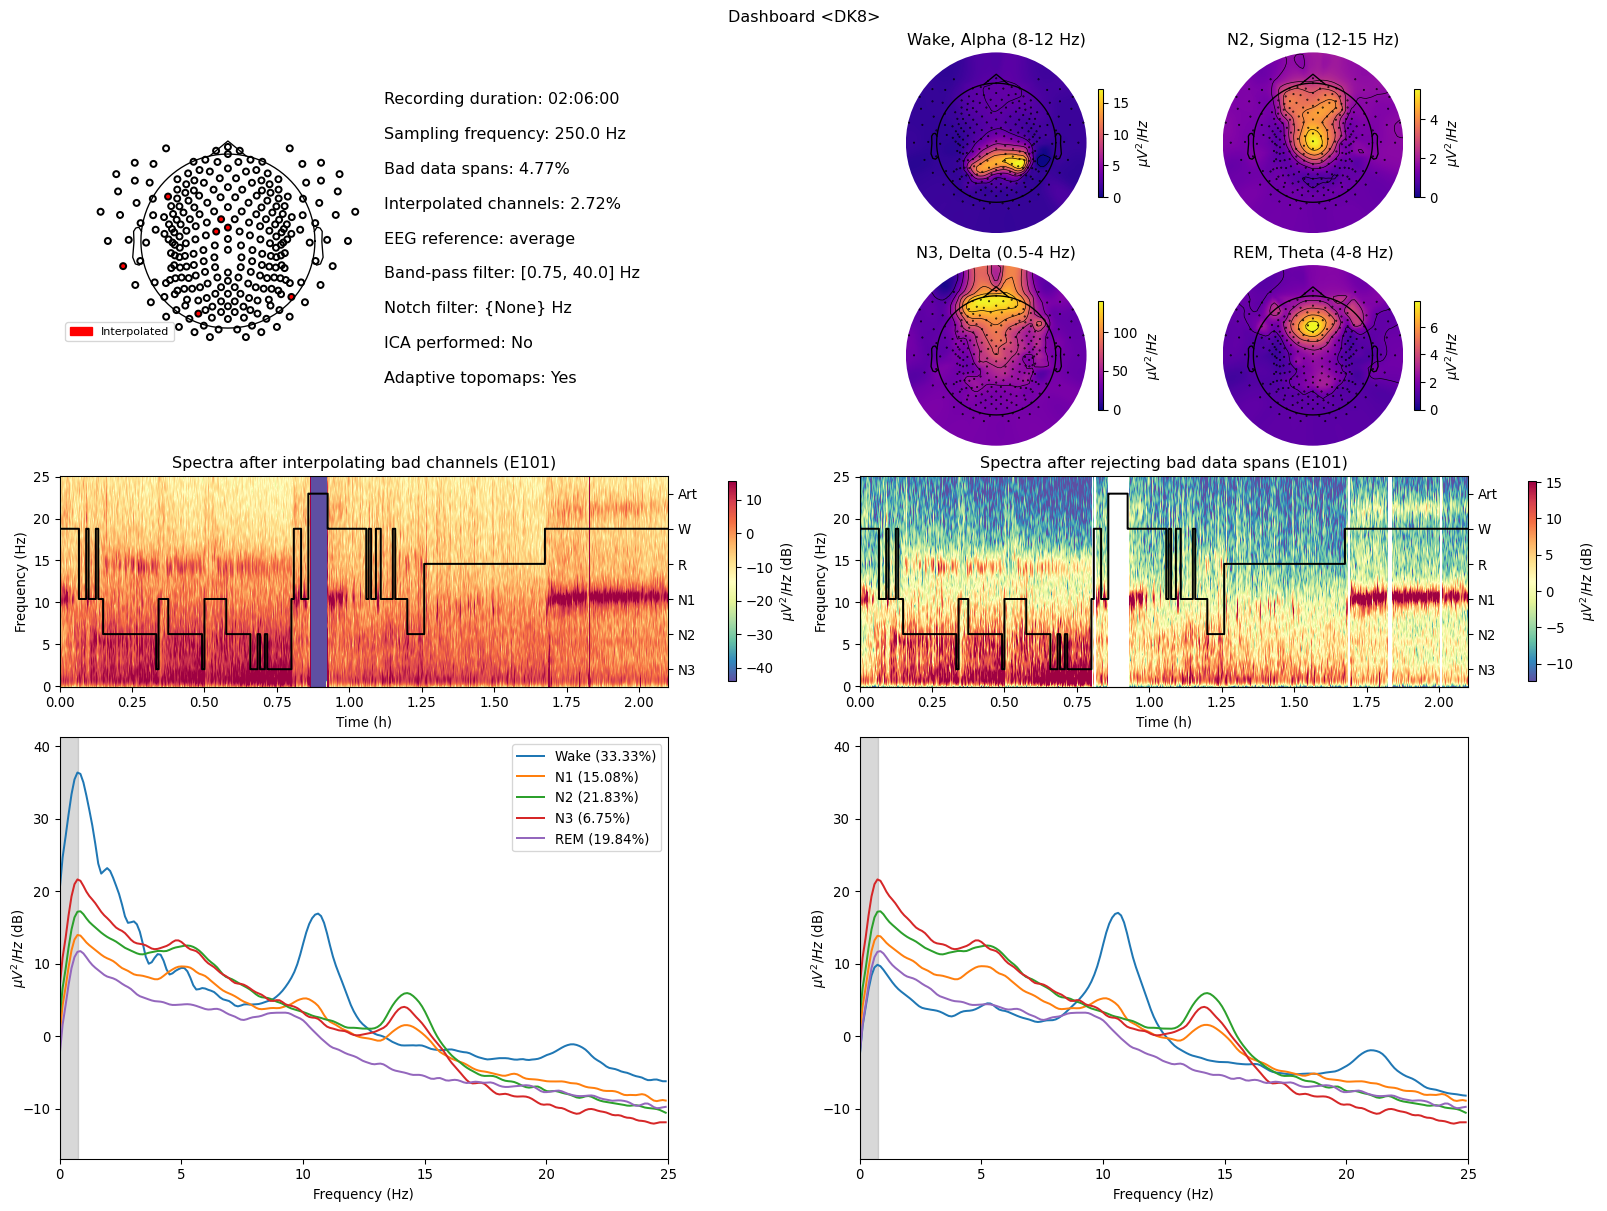
fig = create_dashboard(
    subject_code=subject_code,
    prec_pipe=pipe,
    hypno_psd_pick=picked_channel,
    hypnogram=hypnogram_path,
    predict_hypno_args=hypno_predict_arguments,
    hypno_freq=hypno_freq,
    reference="average",
)
average reference has been applied
Hypnogram is SHORTER than data by 0.0 seconds. Padding hypnogram with last value to match data.size.
ICA
Pass the preceding (cleaning) pipe to the ICAPipe.
ica_pipe = ICAPipe(prec_pipe=pipe, n_components=n_components)
Fit the ICA on the 1 Hz high-pass filtered data.
ica_pipe.fit()
Visually inspect ICA components.
ica_pipe.plot_sources()
2024-10-15 11:30:57,649 - OpenGL.acceleratesupport - INFO - No OpenGL_accelerate module loaded: No module named 'OpenGL_accelerate'
<mne_qt_browser._pg_figure.MNEQtBrowser at 0x3a73945e0>
Pass to the exclude argument indices of components you want to remove from the raw signal.
ica_pipe.apply()
Excluded ICA components: []
Spectral
Pass the preceding (cleaning or ICA) pipe to the SpectralPipe. Also provide pass to the hypnogram and don’t forget to pass its frequency to the corresponding parameter.
spectral_pipe = SpectralPipe(
    prec_pipe=ica_pipe,
    path_to_hypno=hypnogram_path,
    hypno_freq=hypno_freq,
)
Hypnogram is SHORTER than data by 0.0 seconds. Padding hypnogram with last value to match data.size.
If you don’t have a hypnogram, predict_hypno will use YASA’s algorithm.
if hypnogram_path is None:
    spectral_pipe.predict_hypno(
        eeg_name=hypno_predict_arguments["eeg_name"],
        eog_name=hypno_predict_arguments["eog_name"],
        emg_name=hypno_predict_arguments["emg_name"],
        ref_name=hypno_predict_arguments["ref_name"],
        save=False,
    )
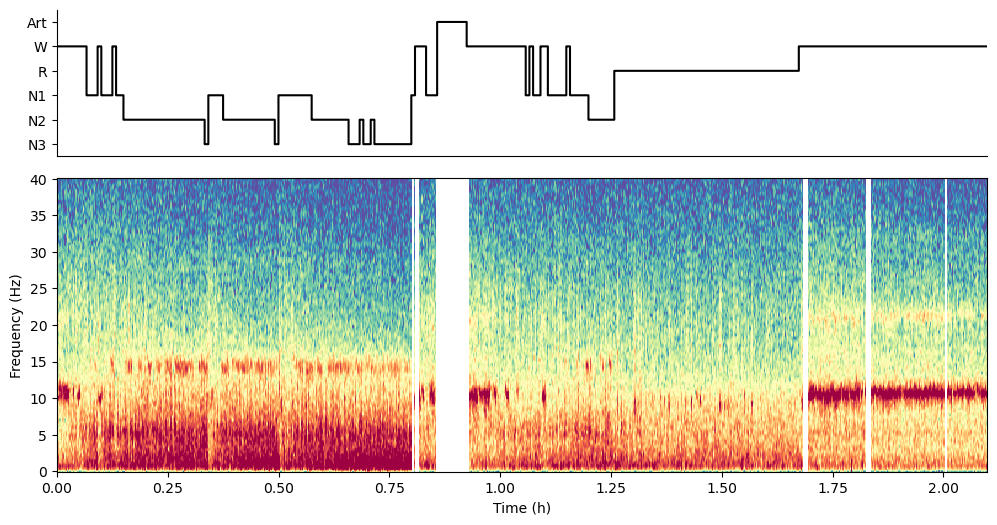
By default, picked_channel will be used to calculate spectrogram. You can pass another electrode name (make sure it exists)
spectral_pipe.plot_hypnospectrogram(picks=[picked_channel])
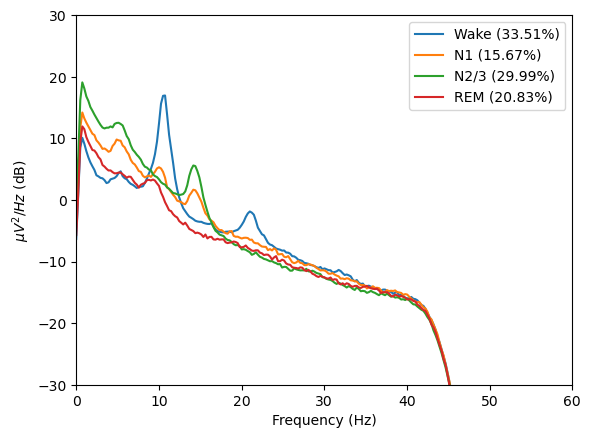
spectral_pipe.compute_psd(
    sleep_stages={"Wake": 0, "N1": 1, "N2/3": (2, 3), "REM": 4},
    reference="average",
    # Additional arguments passed to the Welch method:
    n_fft=1024,
    n_per_seg=1024,
    n_overlap=512,
    window="hamming",
    verbose=False,
)
spectral_pipe.plot_psds(picks=[picked_channel], psd_range=(-30, 30))
Create a collage with rows for sleep stages and columns for bands.
spectral_pipe.plot_topomap_collage()
Events
Pass the preceding (cleaning or ICA or spectral) pipe to one of the SpindlesPipe, SlowWavesPipe, or RapidEyeMovementsPipe. If the preceding is cleaning or ICA - provide a path to the hypnogram and don’t forget to pass its frequency to the corresponding parameter.
spindles_pipe = SpindlesPipe(prec_pipe=spectral_pipe)

spindles_pipe.detect()
spindles_pipe.plot_average(
    center="Peak",
    hue="Stage",
    time_before=1,
    time_after=1,
)
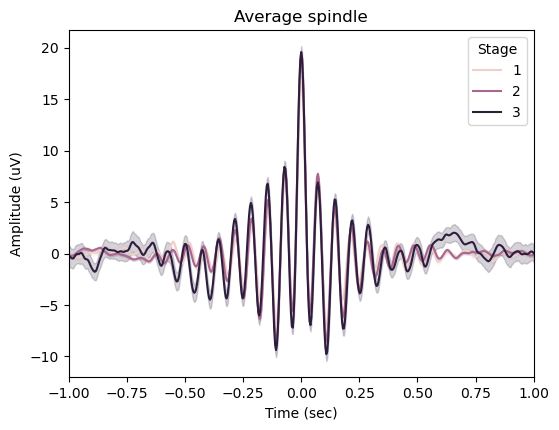
spindles_pipe.results.summary(grp_chan=False, grp_stage=True)
| Count | Density | Duration | Amplitude | RMS | AbsPower | RelPower | Frequency | Oscillations | Symmetry | |
|---|---|---|---|---|---|---|---|---|---|---|
| Stage | ||||||||||
| 1 | 6938 | 365.157895 | 0.869961 | 35.703243 | 7.572310 | 1.669308 | 0.370737 | 13.764517 | 11.291150 | 0.485610 |
| 2 | 20299 | 738.145455 | 0.866909 | 40.815780 | 8.733241 | 1.786240 | 0.363001 | 13.773122 | 11.369723 | 0.495506 |
| 3 | 907 | 106.705882 | 0.724123 | 41.968714 | 9.486414 | 1.902562 | 0.334536 | 13.590072 | 9.345094 | 0.459087 |
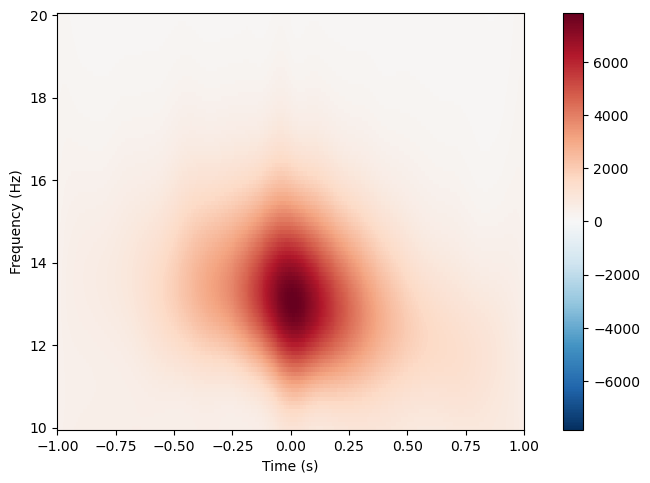
spindles_pipe.compute_tfr(freqs=(10, 20), n_freqs=100, time_before=1, time_after=1)
spindles_pipe.tfrs["N2"].plot([picked_channel])
100%|██████████████████████████████████████████████████████████████████████████████████████████████████████████████████████████████████████| 257/257 [00:15<00:00, 16.48it/s]
100%|██████████████████████████████████████████████████████████████████████████████████████████████████████████████████████████████████████| 257/257 [00:28<00:00,  9.13it/s]
100%|██████████████████████████████████████████████████████████████████████████████████████████████████████████████████████████████████████| 213/213 [00:03<00:00, 56.33it/s]
[<Figure size 640x480 with 2 Axes>]
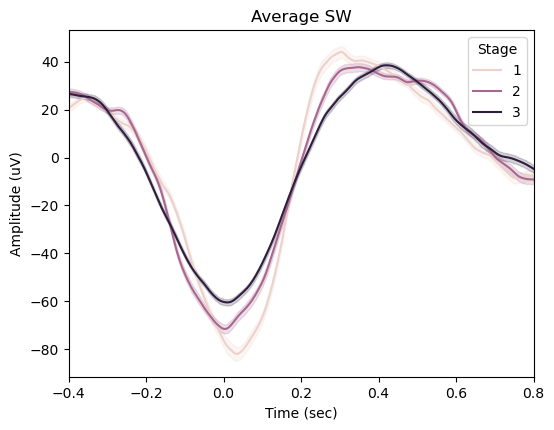
slow_waves_pipe = SlowWavesPipe(prec_pipe=spindles_pipe)
slow_waves_pipe.detect()

slow_waves_pipe.plot_average(
    center="NegPeak",
    hue="Stage",
    time_before=0.4,
    time_after=0.8,
)
Hypnogram is SHORTER than data by 0.0 seconds. Padding hypnogram with last value to match data.size.
Setting up band-pass filter from 0.3 - 1.5 Hz

FIR filter parameters
---------------------
Designing a one-pass, zero-phase, non-causal bandpass filter:
- Windowed time-domain design (firwin) method
- Hamming window with 0.0194 passband ripple and 53 dB stopband attenuation
- Lower passband edge: 0.30
- Lower transition bandwidth: 0.20 Hz (-6 dB cutoff frequency: 0.20 Hz)
- Upper passband edge: 1.50 Hz
- Upper transition bandwidth: 0.20 Hz (-6 dB cutoff frequency: 1.60 Hz)
- Filter length: 4125 samples (16.500 s)
slow_waves_pipe.compute_tfr(
    freqs=(0.5, 5), n_freqs=100, time_before=4, time_after=4, n_cycles=2
)
ploted_channel = "VREF"  # Cz
slow_waves_pipe.tfrs["N3"].plot([ploted_channel])
100%|██████████████████████████████████████████████████████████████████████████████████████████████████████████████████████████████████████| 109/109 [00:05<00:00, 19.18it/s]
100%|██████████████████████████████████████████████████████████████████████████████████████████████████████████████████████████████████████| 203/203 [00:10<00:00, 18.78it/s]
100%|██████████████████████████████████████████████████████████████████████████████████████████████████████████████████████████████████████| 168/168 [00:08<00:00, 18.87it/s]
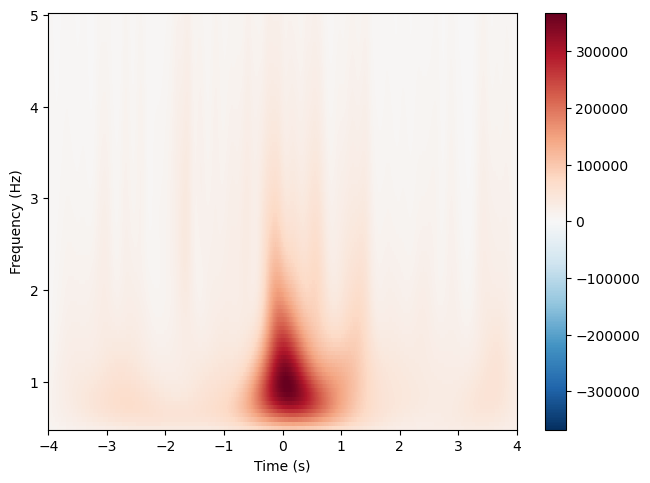
[<Figure size 640x480 with 2 Axes>]
rems_pipe = RapidEyeMovementsPipe(prec_pipe=slow_waves_pipe)

rems_pipe.detect(
    loc_chname=loc_chname,
    roc_chname=roc_chname,
)

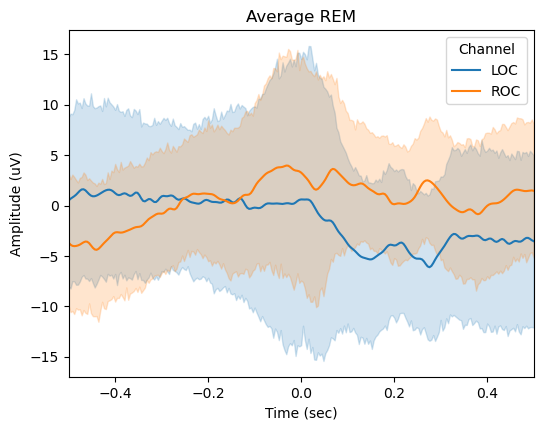
rems_pipe.plot_average(
    center="Peak",
    time_before=0.5,
    time_after=0.5,
    filt=(None, None),
    mask=None,
)
Hypnogram is SHORTER than data by 0.0 seconds. Padding hypnogram with last value to match data.size.
Setting up band-pass filter from 0.5 - 5 Hz

FIR filter parameters
---------------------
Designing a one-pass, zero-phase, non-causal bandpass filter:
- Windowed time-domain design (firwin) method
- Hamming window with 0.0194 passband ripple and 53 dB stopband attenuation
- Lower passband edge: 0.50
- Lower transition bandwidth: 0.50 Hz (-6 dB cutoff frequency: 0.25 Hz)
- Upper passband edge: 5.00 Hz
- Upper transition bandwidth: 2.00 Hz (-6 dB cutoff frequency: 6.00 Hz)
- Filter length: 1651 samples (6.604 s)
